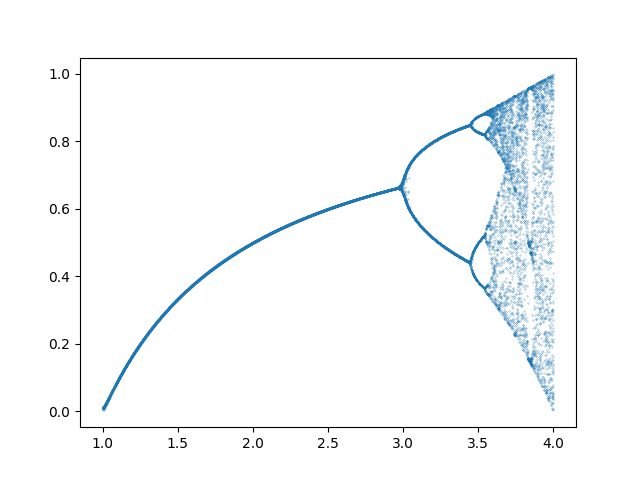
The Canonical Bifurcation Diagram. Very Cool
python code snippet start
import numpy as np
import matplotlib.pyplot as plt

xy = {}

# Iterative logistic map function
def iterative(x, a):
    return a * x * (1 - x)

# Loop over values of 'a' from 1 to 4 with small step size
for a in np.arange(1, 4, 0.0001):
    # Start with a random initial condition
    temp = iterative(np.random.default_rng().random(), a)

    # Iterate 100 times to reach the steady state
    for i in range(100):
        temp = iterative(temp, a)

    # Store the final value for bifurcation diagram
    xy[a] = temp

# Plot the bifurcation diagram
plt.plot(xy.keys(), xy.values(), linestyle='None', marker='o', markersize=0.2)
plt.show()
python code snippet end